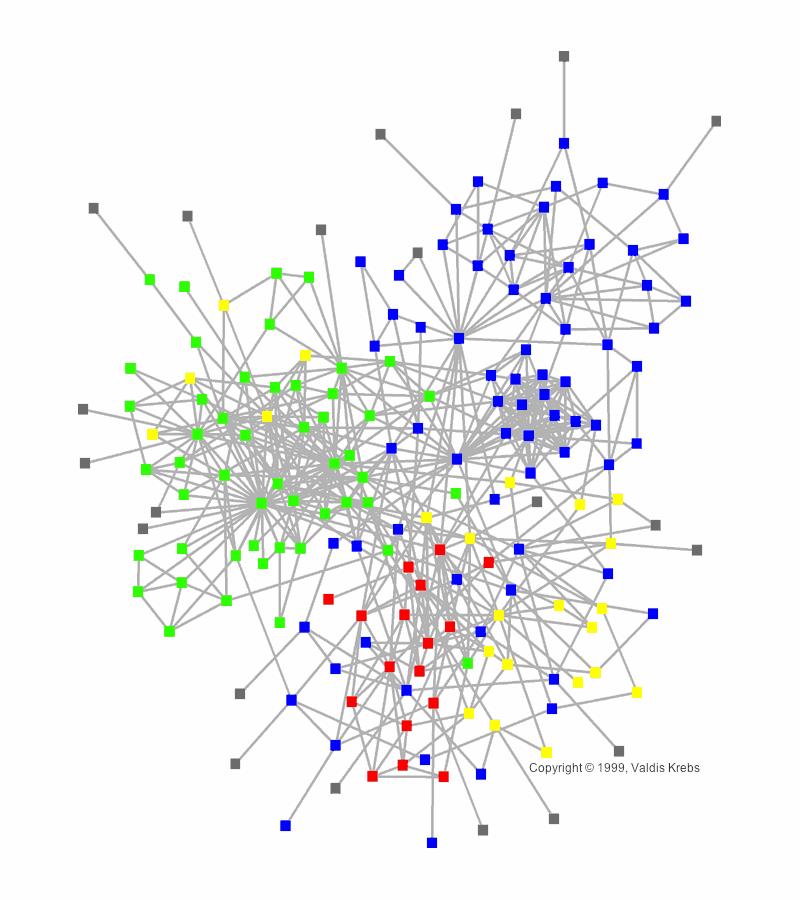
The most common diagram for understanding how an organization works is the org chart. An alternative diagram is produced by organizational network analysis (ONA). Whereas an org chart shows formal reporting relationships, an ONA diagram shows who interacts with whom. An ONA diagram will look something like the graphic (and thanks to Vladis Krebs, an ONA expert for the image).
Experts can analyze these diagrams in many different ways; for example, they may look for people who are key nodes (e.g. they are critical in connecting two parts of the organization) or ones who appear to be isolated.
A really cool evolution in using ONA comes from Cisco, which has been experimenting with depicting the diagram with virtual reality. With this approach managers can “walk” through the network, looking at who is connecting to whom. As you can imagine this may be easier and more visceral for a manager than looking at a two-dimensional print-out.
I love how this approach complements the more traditional analysis. It reminds me of the difference between a manager being given reports about what the factory is doing versus taking a stroll through the factory to see what is happening. Both approaches bring their own insights and they work well together.
Will this approach end up being useful? It’s too soon to say, but congratulations to Cisco for pioneering a new tool for understanding organizations.
What’s interesting?
- It’s interesting to see an “exotic” tool like virtual reality being deployed in HR
What’s really important?
- ONA has always been intriguing but was difficult to do well. It’s getting easier to generate the maps and make sense of them; it’s an important area for HR to know.
- I’m impressed that Cisco had a team in HR with the resources to do this kind of R&D. The unit that led it was “Leadership and Team Intelligence” (what a great name for an HR unit!) As HR becomes less transactional it needs to become more intelligent and if it can develop fresh tools for analysis then that is outstanding.
