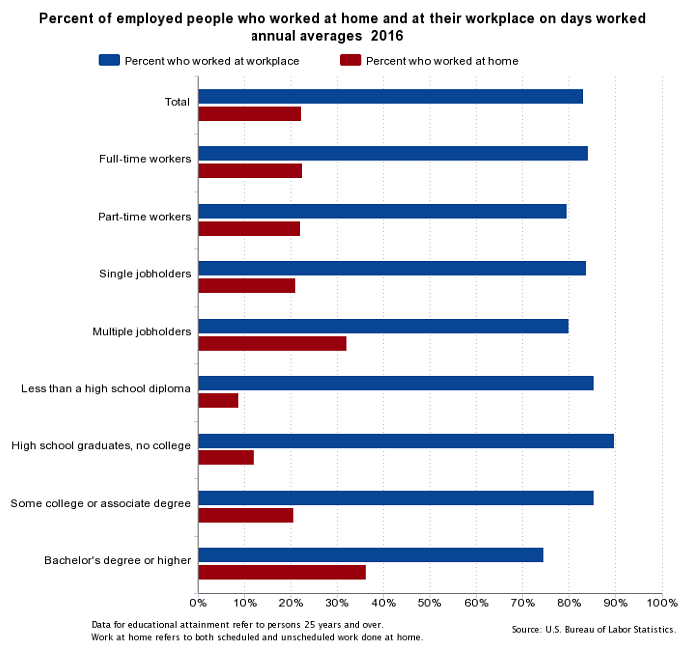
At the end of June the U.S. Bureau of Labor Statistics (BLS) released the results of its 2016 American Time Use Survey (ATUS). For the second year in a row the press release emphasized the fact that workers are more likely to do some or all of their work at home. A new statistic added to 2016’s survey revealed 43% of workers with advanced degrees work at least part of their day from home.
This is just one intriguing datum from the annual ATUS survey. Since 2003, the ATUS survey has shown Americans are working increasingly longer hours, while leisure time decreases and sleep, housework, self-care, and family-care patterns remain substantially the same. We’re not quite a nation of overworked drones but we may end up there if some of these trends continue. Fortunately, the trend toward working at home, indicating a growing independence from the classic workplace, seems to be offsetting this possibility. When your commute amounts to a few dozen feet, longer working hours are counterbalanced by less time wasted preparing for work.
This year, the surveyors questioned 10,500 individuals, 400 less than last year. As always, they were aged 15 or older and came from all walks of life. As a result, ATUS data includes contributions from the unemployed, high school students, and retired individuals in addition to workers AND accounts for every day of the week, including weekends and holidays.
Clearly these factors skew the total when it comes to working hours. The point of the survey, however, is to study all time used, not just work time; this includes leisure time, eating, sleeping, visiting, caring for children and the elderly, self-care, and a number of other factors. Researchers must take care to pull accurate working data from the tables, lest they draw false conclusions.
Let’s see what we’ve learned this time:
This past year 22% of all workers worked from home all or part of the day. In 2003, the first year surveyed, the number of was 19% and for 2015 it was 24%.
This year, for the first time, ATUS distinguished between workers holding bachelor’s degrees and those with more advanced degrees like J.D.s, M.D.s, Ph.D.s, MBAs, and Master’s degrees. Overall, 43% of workers with advanced degrees worked from home, while 31.6% of workers with bachelor’s degrees did. However, the combined total for bachelor’s degrees and higher was 36.1% in 2016 as opposed to 39% in 2015

In contrast, 12% of workers holding only high school diplomas worked from home, down from 14% last year (NOTE: This number was previously reported as 9% before later revision.)
The drop in the percentages of both degree-holders and diploma-holders working from home coincides with the overall decrease from 24% to 22% — a significant difference, according to Harris Research. That said, a significant portion of Americans still regularly work from home. It will be interesting to see if this number rises or falls for 2017.
Although we saw a dip in average daily working time in 2015, in 2016 we’re up beyond 2014’s average of 3.25 hours to 3.28. Add in all work-related activities and the total rises to 3.61 hours.
The working population also grew by over 3%, or 4,889,000 people — 161,767,000 workers, as opposed to 156,867,000 in 2015.
The average workday for those who worked rose from 7.57 to 7.61 hours, though we’re still down from 2014’s 7.73 hours. Add work-related activities and it’s 8.02 hours. That’s quite a lot when you consider it includes both part-time and full-time workers and every day of the week, including weekends and holidays — suggesting the average American works a punishing 56+ hours a week.
The average hours per workday break down differently. Full-time workers worked a bit longer in 2016 on the days they worked, at 8.15 hours vs. 2015’s 8.06 hours; the total for part-time workers is about three minutes more at 5.35 hours vs. 5.3 hours.
The weekday total for full-timers was 8.56 hours this year, up from 8.46 in 2015 and mirroring the total for 2014. Part-time workers worked an average of 5.34; 2015’s number was 5.80 reflecting almost a half-hour drop.
Full time workers worked 5.44 hours on the average weekend or holiday, as opposed to 5.27 hours for part-time workers. That’s down about ten minutes overall from 2015, at 5.62 and 5.42 hours respectively.
A total of 110,592,000 people worked on an average day in 2016, a leap of over 3.8 million from 2015’s 106,765,000 people—almost four times last year’s rise. Again, it’s clear the workforce increased rapidly, suggesting the American economy was motoring along just fine last year.
Most other time-use factors don’t change much from year to year. In 2015, workers over 18 slept an average of 8.42 hours daily, dropping about 2 minutes to 8.39 hours in 2016. Unemployed Americans slept 9.12 hours, down about nine minutes from 2015’s 9.27 hours. They also did more household work in 2016, spending 2.99 hours per day as opposed to 1.63 spent by workers. That’s up from 2.94 vs. 1.54 hours per day in 2015, explaining where the extra sleep-time went.
Average leisure time remained nearly static. In 2015, workers spent 3.63 hours at leisure, with TV-watching comprising 1.83 hours. In 2016, the numbers hit 3.62 and 1.78 respectively. The unemployed averaged 5.06 hours of leisure, down half an hour from 2015, with an 18-minute drop in TV-time: 2.65 in 2016 vs. 2.95 hours the previous year.
The bottom line
This year’s ATUS study confirms the trend toward decentralization in the workplace, though the overall percentage is a bit lower. Another notable statistic is that the overall workforce has grown by almost five million people in one year, more than quadrupling last year’s growth rate. This is welcome news, suggesting the Great Recession and its effects are at last, receding into memory.
This was originally published on Laura Stack’s The Productivity Pro blog.
