A Simple Metric to Realize the Success of Diversity and Inclusion Initiatives
There is an increasing trend among progressive organizations to invest in Diversity and Inclusion measures that can provide a competitive edge. However, these well-meaning initiatives often fall victim to an imbalance between diversity and inclusion, which dilutes any benefits from such endeavors. One of the key success factors (KSFs) in avoiding this fate is ensuring timely management reviews supported by effective preventive and corrective actions to avert the derailing of the whole exercise.
This article introduces a metric — The Rainbow Score (TRS) — which can be used to provide an effective input to gauging the success of Diversity and Inclusion initiatives.
The Rainbow Score
The Rainbow Score is a simple formula that is the product of three primary factors: Diversity, Inclusion and RAPID (an acronym for significant factors of the senior level commitment). This has been depicted as a product since diversity is meaningless if there is no inclusion and support from the top. It also highlights the amplification aspect that emanates from the synergistic collaboration of all three primary factors. Its mathematical version is as follows:
TRS = (D) * (I) * (RAPID)
- D = Diversity = Sum of all scores pertaining to significant factors impacting Diversity
- I = Inclusion = Sum of all scores pertaining to significant factors impacting Inclusion
- RAPID = Sum of all scores pertaining to significant factors of senior management commitment.
- R = Judicious allocation of necessary resources
- P = Passionately discernible advocacy for D&I
- A = Aligned behavior for reinforcing personal engagement
- I = Invigorating leadership for employee morale & motivation
- D = Dogged focus on achieving success
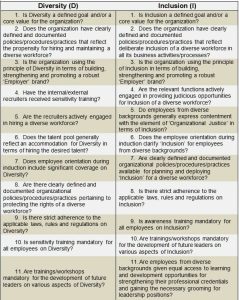
The significant factors impacting Diversity and Inclusion are given in this table. (Click to download the entire document.)
Let’s measure each of the aforementioned significant factors by using a scale from 1 to 5, where:
- 1 = Need to revive
- 2 = Some signs of life
- 3 = Getting warmer
- 4 = Feeling good
- 5 = Delightful!
The maximum score for Diversity (D) is: 30 * 5 = 150
The maximum score for Inclusion (I) is: 30 * 5 = 150
The maximum score for RAPID is: 5 * 5 = 25
The maximum Rainbow Score is: 150 * 150 * 25 = 562,500 or 100%
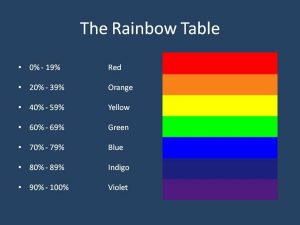
Convert your organization’s TRS score to the nearest percentage whole number and use the following Rainbow chart to see where your organization’s current status is with respect to the success of Diversity and Inclusion initiatives:
The aforementioned exercise should be carried out by a representative of senior management who is given full authority, assistance and access for coming up with the respective metric. Subsequently, they should prepare a report with recommendations for senior leaders to examine the status quo and decide on a suitable course of action.
Additionally, The Rainbow Score can also be harnessed for deployment of strategic tools, e.g., The Balanced Scorecard, McKinsey 7S Framework, SWOT analysis, Mintzberg’s 5Ps of Strategy, Weisbord’s Six-Box Model, Blue Ocean Strategy, etc., and for improving the Triple Bottom Line (TBL/3BL).
Parting thoughts
Diversity and Inclusion are strategic imperatives that embellish an organization’s core competencies. Astuteness is required in the development and deployment of relevant initiatives to complement a management system that can resist apathy, complacency and delusion in good times while buffering against confusion, desperation and bottlenecks in challenging times. Here’s to your success!
